It's Paper Time
Hello again, friends!
I'd like to start by saying welcome to all the new people who have joined. I'm fairly new myself, but am starting to feel really comfortable and more confident in my work. The blogs I've seen so far are really interesting and I can't wait to see all the different research. STEM is really amazing and can reach so many different facets and learners.
The rough draft of the paper is due next week. My sentiments about that include anxious deep breaths. In all seriousness, my goal is for it to be very clear, logical, and worthy of the topic.
I am removing population density of humans and rodents from my variable table. The data is more inconsistent in rodents and the mammals vary so much in species, reproduction styles and rates, and community distance proximity. The pursuit was not fruitless and I learned a lot about flea carriers and disease spread in the process. However, I think the prospect of population density data was short-sighted and not well thought through on my part. I'm a little disappointed in that, but that's learning, right?
I don't have very much new information on my topic to report. Slightly backwards, I organized my reference list first. At meal time, I eat what I dislike the most first. With papers, I try to do the part I dislike first and that's writing out the reference list. Josh kindly told me about a Word program to help with that.
I have made some graphs, but they are embarrassing and I'm not ready to share them with you all. The data is really well organized and I have figured out the scales and organization but they are plain as paper, which is not acceptable.
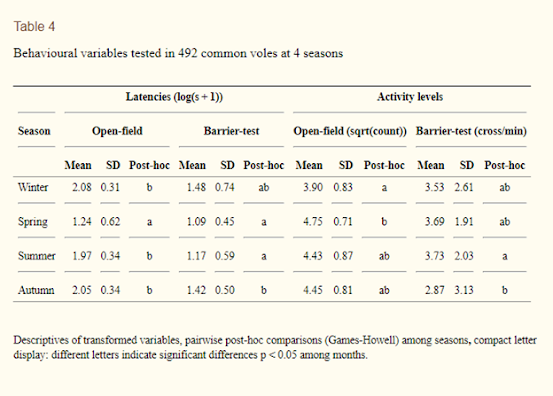
Despite choosing to exclude population density of rodents in my data set. I found a really interesting study I would like to share. The journal is titled Seasonal variation in the behavior of short-lived rodents. I found it in NCBI database and it was created by Janna A. Eccard and Antje Herde in 2013.
Ironically enough, it contained a lot of information on variations in densities of population depending on the season and production results post-winter. Here is one of their tables that compared their activity levels is the different seasons. Table derived from:
https://www.ncbi.nlm.nih.gov/pmc/articles/PMC3870992/
Good luck to you all! Everyone cross your fingers I can get this all done in time! I had a really rough cold this week (not covid-19). Being sick put me behind and I'm in catch up/Rocky mode. Eye of the tiger time for this paper.


If you need help with graphs just give a shout. Excel/google sheets is fairly powerful. If you are familiar at all with python seaborn makes beautiful charts.
ReplyDeleteI agree with Richard, google helped make the graphs I used one of my papers. To answer your question, yes! Making mistakes or realizing the importance of something is definitely the learning process. You are doing great and I am glad that you feel better this week.
ReplyDelete